- Edexcel - C1, Algebra and Functions
- AQA - C1, Algebra
- OCR - C1,Coordinate Geometry and Graphs
Almost finished with Algebra and Functions, We now need to know how to sketch certain functions, aswell as know how to interpret graphs to solve equations, and know how to apply different transformations (this will be covered in the next post).
In the specification, it says sketching curves defined by simple equations. I shall teach you how to draw linear, quadratic and cubic functions. Though the first two you should have known from gcse. Aswell as teaching you k/x functions where k is a integer (this is a reciprocal function).
Linear Functions
So if you see a function like y=3x + 2, or y= x or y = -4x.... these are known as linear functions, simply because they are straight lines.. and are of the power 1 (exponent). We usually see them in the form y=mx + c, but we will see in the next section Coordinate Geometry, they can be rearranged in the form ax + by + c aswell. Let's focus in the form y= mx + c.
m = gradient of the function (slope)
c = y intercept
If you take y to be 0 : you will get 0 = mx + c, rearrange for x this should be the point on the function when y=0, or where it crosses the x-axis. Likewise if you make x=0, you will get y=c, this is the point on function when x =0, or where it crosses the y-axis.
To plot a function, if you take different values of x and y, you could plot it up... though we are meant to sketch functions in a general way. So Linear Functions are straight lines .. so let's take 3 examples.
a) y= 2x - 5
Firstly we know m = 2 (gradient), and c = -5 (y intercept), this is easy to see in this form, but not all linaer functions are in this form REMEMBER, y= 4x , is still a linear function even though c = 0.
y intecerpt = take x =0, so y= 2(0) - 5
y= -5
We've got a coordinate on the function which is (0, -5)
x intercept = take y =0, so 0 = 2x - 5 so 5=2x so x = 5/2
Another coordinate is (5/2 , 0)
As we know it is a straight line just draw a corresponding straight line using the two points :
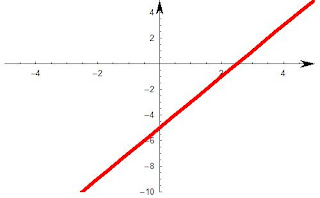 |
| Graph of y=2x-5, notice where it croses the axis, it's just a straight line through the points |
b) Let's take y = -6x
Here m = -6 (negative gradient ), and c = 0
y - intercept, y = -6(0), y = 0, so when x =0, y= 0.
First coordinate (0,0)
x- intercept, y =0 so 0 = -6x so 0/-6 = x, so x =0
Second Coordinate (0,0)
As we already knew (0,0) from the first coordinate, the 2nd step was futile.. so we
simply substitute other values to get a general shape of the graph.
when x = 1, y= -6
when x = -5, y = 30
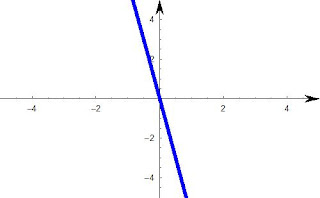 |
| Graph of y = -6x, notice the gradient (m) is negative, so it is downward sloping, and it goes through the origin (0,0). |
Quadratic Graphs
As we know from the previous section, that quadratic functions are in the form ax^2 + bx + c = 0. If we have two solutions to the equation (two roots), these are the corresponding x - values where y =0, or the two x intercepts.
We know that a quadratic is a parabola shape, and the coefficient of x squared, determines whether it is a U or a upside down U. If the coefficient is negative, it is an upside down U, if positive it is a U shape. Again we know c is the y intercept ( or where x =0). There will also be a minimum or maximum point on the graph, (depending the parabolic nature), this can be found through differentiation (later on...).
e.g. 1 ) y = 2x^2 - 8x + 6
Firstly a =2, so it will be a U shaped parabola shape.
substitute x =0, so y= 6, the y intercept is 6. One coordinate is (0,6)
Now find the roots of the quadratic, (through one of the three methods).
Let's do it by factorisation, divide everything by 2.
x^2 - 4x + 3 = 0
(x-3)(x-1) = 0
so x=1,3 (these are the points which the function cross the x-axis.
(1,0) and (3,0)
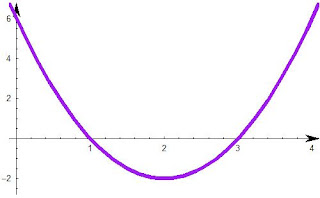 |
| Graph of example above. a) positive a, so U shape parabola, and two roots. |
2nd example :
y = -
x2 - 4
x - 3
a is -1, so it is an upside down U shape.
y intercept is -3 , (0,-3)
now solve for x :
-
x2 - 4
x -3 = 0
-(x -1) (x-3) =0
so x =-1 and x = -3
so (-1,0) and (-3,0)
 |
| Graph of -x2 - 4x -3, notice where it crosses the axis and the shape. |
Cubic Functions
A cubic is in the form ax^3 + bx^2 + cx + d = 0, here again the a decides the shape... we know the cubic shape is a kind of S shape (looking at it with your head tilted). if a is negative then the graph will go from right to left, if positive, then left to right. Here's what i mean :
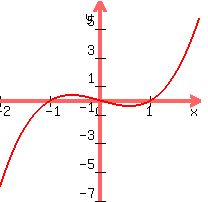 |
| When a is positive |
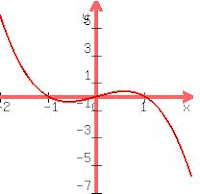 |
| When a is negative |
Again we have to find the x intercepts, by setting the equation equal to 0. And solving, this can be done sometimes if you know one factor, leaving you with a quadratic, which would give you the other two. The y-intercept is found by making x=0.
A cubic will have either 3 roots, 2 roots or 1 root. (it crosses the x-axis 3 times, 2 times or once.)
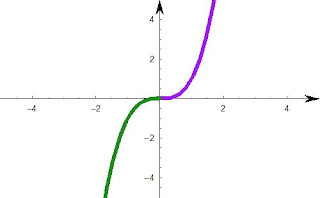 |
| Graph of x^3, notice here there is one root, at the origin (0,0). |
Example 1
y = x(x-2)(x+3)
This is a cubic, but factorised, it we were to expand it, it would give us in the form of ax^3 + bx^2 + cx + d, but when factorised it is easy to draw a cubic. We are only expected to sketch easy cubics at this stage, as solving it, is in C2 (using factor theorem, and algebraic division). If it is already factorised, it is easy to draw... for this example. We have three roots, x=0 , x =2 and x =-3, these are the points where the function cross the x-axis.Remember, so cubics can have two roots, so one may be a repeated root.
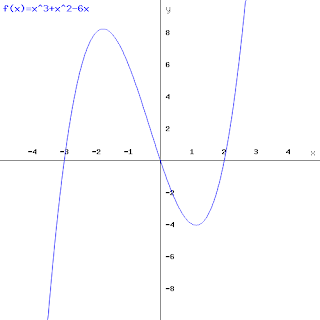 |
| Graph of the cubic (x^3 + x^2 - 6x), when expanded, notice the roots at -3,0 and 2. It has two turning points. |
|
|
Example 2
x^3 -9x.
Let's try factorising this, if we take x out we get x(x^2 -9). So one root is 0, now we have x^-9. Remember a difference of two square where you have something in the form of
x^2 - a. Where a is a square number, if this is the case, the roots of the equation are
+root of a and -root of a. In this case a = 9, so the roots are 3 and -3.
All the roots of this cubic are -3, 0 , 3. So we have the coordinates (-3,0) (0,0) and (3,0). The y intercept is 0.
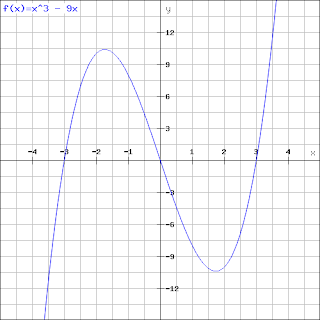 |
| Three roots at 0, -3 and 3. |
Reciprocal Graphs
The reciprocal function is y = 1/x. The curve of this function looks like a hyperbola, this is the graph of 1/x :
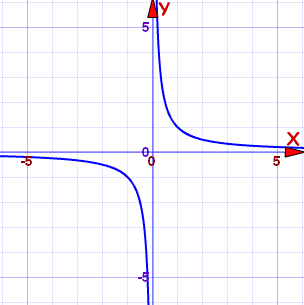 |
| Graph of 1/x |
There is one special feature of graphs of the form k/x, where k is some number(and x is not 0). These graphs have a feature called Assymptotes. This graph has two assymptotes, at x=0 and y=0, meaning the graph tends to x=0, and y=0, but never never touches it, thus the shape of the graph. The
x-axis is a horizontal assymptote, while the
y-axis is a vertical assymptote.
Assymptote - A line where a curve gets closer and closer to but does not meet.
By substituting 0 as x or y, we can find the intercepts of the axes.
If two graphs meet, this algberically, means setting two of the equations equal to each other, the coordinates of intersection, can be found by solving.
A cubic can have one, two or three roots.


